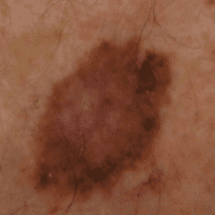
Malignant melanoma
Malignant melanoma is the most serious form of skin cancer arising from the pigment producing cells in the skin known as melanocytes
Melanoma is the commonest cause of skin cancer death worldwide. Unfortunately, New Zealand has the highest incidence of melanoma and Tauranga, the highest incidence within New Zealand. Chances of curing melanoma are directly related to how deep it has grown in the skin when diagnosed. The earlier it is picked up, the higher the chance of cure. If treatment is left too late, melanoma has the ability to rapidly spread throughout the body. Melanoma most commonly arises from a new or changing mole on the skin, although rarely can occur on the skin of the palms, the soles and even the nails.
Published Literature
Extremely High levels of Melanoma in Tauranga, New Zealand: Possible Causes and Comparisons with Australia and the Northern Hemisphere.
Salmon Paul JM1,2 FRACP
Chan Weng Chen
1 FRACP
Griffin Jenny FRACPath
Mckenzie Richard
3 D Phil
Rademaker Marius
1 FRACP
Departments of Dermatology
1 Waikato Hospital and SkinCentre2, Tauranga and National Institute of Water and Atmospheric Studies,3 New Zealand
Summary
The objective of the study was to ascertain the incidence of melanoma in the Tauranga region of New Zealand, to compare these findings within Australasia and the Northern Hemisphere, and to understand the causes of the relatively high rates in Tauranga.
Data were obtained from retrospective review of histology reports from the public and private health systems in greater Tauranga (Tauranga and Western Bay of Plenty Districts). Primary cutaneous melanoma (including both invasive melanoma and melanoma-in-situ) reported during 2003 were included. Age standardised melanoma rates were calculated for the entire population as well as for the non-Maori population of the region, identified from the 2001 New Zealand Census.
The age-standardised incidence of invasive melanoma, in non-Maori population of the greater Tauranga region, was 79/100,000. The age standardised rate for the entire population was 70/100,000. The rate of in-situ disease was 78/100,000 for non-Maori, and 72/100,000 for the entire population.
The Tauranga region of New Zealand has an exceptionally high incidence of invasive melanoma and melanoma-in-situ. This is likely related to environmental, geographic and societal factors including our relatively high levels of UV, exacerbated in recent times by ozone depletion, our relatively cool summer temperatures which encourage outdoor exposure, and our relatively fair skin colouring.
Key words: ultraviolet light radiation, UV index, ozone depletion, skin cancer, epidemiology.
Introduction
Melanoma rates have been increasing worldwide over the past decades, with an annual increase of between 3-7%, or a doubling of incidence approximately every 10 to 20 years.
1-3 In New Zealand and Australia, melanoma is the 4th commonest cancer in males and the 3rd commonest in females (excluding non melanoma skin cancer).4,5
The objective of this study was to determine the incidence of melanoma in the Tauranga region and to compare the findings with other studies, both within New Zealand and Australia, and the Northern Hemisphere.
An earlier study in the Tauranga region showed that, during the period 1980-9, the age standardised incidence of invasive melanoma was 33.0/100,000 (men 31.4, females 36.8).
6 This rate was comparable to the incidence rates seen in Queensland, Australia at that time. This earlier study also showed there had been a 2.25 fold increase in melanoma rates over the 1980s.
Methods
The study population consisted of people resident in the Tauranga and Western Bay of Plenty region of the North Island of New Zealand, as defined by local government boundaries.
Data were obtained from retrospective review of histology reports from the single pathology laboratory, which processes all of the histology specimens in the study region. A computer search was performed using the following terms: "melanoma", "lentigo maligna" and "melanotic freckle".
Primary cutaneous melanoma (including melanoma-in-situ), reported from January 1st to December 31st 2003, were included in the study. Individual reports were analysed and the following were excluded: incisional and punch biopsies, wider local excision of previously excised melanoma, metastatic melanoma, non-cutaneous specimens and specimens from people not resident in the study area. Duplicate registrations were identified and excluded.
An Excel dataset was compiled, including: age, sex, site of lesion, Breslow thickness and month of histological diagnosis.
Multiple primaries in a single patient were noted. However only the first lesion excised was analysed, in accordance with the practice of the International Agency for Research on Cancer (IARC) and the International Agency of Cancer Registries.
7
Population information was derived from the most recent New Zealand Census, conducted in 2001
8 and based on the usually resident population. In order to allow national and international comparison, incidence rates were calculated using non-Maori(Maori are the indigenous Polynesian inhabitants of New Zealand) and total (including all ethnicities) population figures.
Age standardised incidence was calculated using the direct method and the standardised age distribution proposed by Segi (1960) World population, allowing comparison between countries with differing age structures.
9 A generalised logits (log of the odds) model was used to investigate whether type of lesion (invasive or in-situ) and sex were associated with the site of melanoma. Analysis of Breslow depth was performed using the Mann Whitney U test.
Data were collected on salient features of geography such as latitude, temperature, humidity, sunshine hours, satellite-derived ozone, and incident ultraviolet radiation from spectrophotometry. The UV radiation data are provided via the UV Atlas CD, which was developed by the National Institute of Water and Atmospheric Studies (NIWA).
10,11 Demographics of the Bay of Plenty area were obtained from territorial authority records.
Results
From an initial dataset of 316 primary melanoma, 28 were excluded as the patients were resident outside the study area. Of the remaining lesions, 8 were excluded from patients who had multiple lesions diagnosed during the study period, following the IARC practice for Cancer Registries; thus 280 lesions were analysed. Of these, 131 were invasive and 149 were in-situ lesions (Table 1). An unknown number of patients from the Tauranga region sought medical care in adjacent regions, particularly Waikato and Auckland. Unfortunately we were unable to determine the number of such patients, so this total is likely to be an underestimate.
Demographics
The non-Maori population of the Tauranga region was 108,627 people (52,299 males). When all ethnicities were considered, there were 129,138 people (62,328 males). The median age was 38 years with 17% aged 65 or older. Most of the population (88%) identified themselves as European, 16% Maori, 2.5% Asian and 1.6% were Pacific Islanders. The total is more than 100% as the New Zealand Census allows self-identification of up to 3 ethnic groups. In the study area, the non-Maori population closely approximates that of the Caucasian or European population. No cases of melanoma were identified amongst Maori, but ethnicity data in the pathology register was incomplete.
Incidence
The overall crude annual incidence of invasive melanoma in the non-Maori population of Tauranga and the Western Bay of Plenty was 121/100,000, with an age-standardised incidence of 79/100,000 (95% Confidence Interval (CI) 63 to 94/100,000). There was no significant difference in the incidence of invasive melanoma between males and females, with rates of 75 and 84/100,000, respectively. When all ethnicities were included, the overall age standardised incidence of invasive melanoma was 70/100,000 (CI 57 to 83) with no significant difference between the sexes: male 67/100,000 and female 74/100,000. This rate equates to a yearly increase since 1980 of almost 2/100,000 per year.
6
The overall age standardised incidence of in-situ melanoma in the non-Maori population was 78/100,000 (CI 65 to 91), with no significant difference between the male and female populations. When all ethnicities were included, the overall age standardised incidence of in-situ melanoma was 72/100,000 (CI 60 to 83), again with no significant difference between the sexes.
The combined age standardised rates for both melanoma and melanoma-in-situ in the Tauranga region of New Zealand in 2003 was 157/100,000 for the non-Maori population and 142/100,000 for all ethnicities.
Age
The ages of diagnosis of invasive and in-situ melanoma were very similar, with little difference between the sexes. The median age of diagnosis for invasive melanoma was 61 years (range 15 to 94 years) and for in-situ disease, 63 years (29 to 93 years). There was a tendency for the age specific incidence of invasive and in-situ disease to increase with age. However, it was difficult to draw conclusions from the data at extreme age, due to small numbers (Fig. 1).
Site
There was no evidence that the relationship between sex and site varied with type of melanoma (p=0.3). There was an association between site and sex (Fig. 2); females were more likely to have melanoma on the leg and males, on the trunk (p<0.0001). There was also an association between site and type of melanoma; in-situ lesions were more likely to be on the head than on other sites (p<0.0001) (Fig. 3,4).
Breslow depth
To enable comparison with an earlier study of invasive melanoma in the same region,
6 Breslow depth was analysed in the following categories: in-situ; invasive melanoma measuring less than 0.76mm; 0.76 - 1.49mm and greater than 1.5mm. There were 149 (53%) in-situ melanomas. Of the 131 invasive lesions, 74 (56% of invasive melanomas) were less than 0.76mm, 26 (20%) measured between 0.76 - 1.49mm and 31 (24%) were greater than or equal to 1.5mm in depth.
Using current standard terminology, two thirds (86 lesions) of invasive melanomas were thin (Breslow depth < 1.0mm). About 30 % (40 lesions) were of medium thickness, measuring between 1.0 and 4.0mm, with only 4% (5 lesions) being considered thick, i.e. over 4.0mm in Breslow depth (Fig. 5).
The median Breslow depth of invasive melanoma in males was 0.7mm ranging from 0.2mm to 7mm. In females, the median Breslow depth was 0.64mm with a range from 0.26mm to 9mm (Fig. 6). There was no significant difference between the sexes (p=0.4).
Month of histological diagnosis
There was no significant trend noted in the month of histological diagnosis of melanoma lesions.
Geography and UV radiation
The Western Bay of Plenty and Tauranga lie at 37º South. On average the region receives 2260 sunshine hours per year. The noontime UV Index (UVI) over the summer months averages about 12, and sometimes reaches 14.
11 UVI values greater than 10 are considered "extreme". In terms of the now-outdated "time to burn", a UVI of 12 corresponds to a "burn time" of approximately 12 minutes (i.e. the first signs of skin reddening on fair skin that has not previously been exposed to sunlight can be detected following exposure time as short 12 minutes). A UVI of 6 would correspond to a "burn time" of 24 minutes. Figure 6 shows time series of hourly-averaged values of UVI at Tauranga, as derived from the New Zealand National Institute of Water and Atmospheric Research (NIWA) UV Atlas.10,11
Discussion
The UVI is strongly influenced by the solar elevation, so the annual dose is dominated by that received in the summer. Higher values of UVI occur at lower latitudes, e.g. in the tropics, where solar elevations are higher. However the UVI values at mid-southern latitudes are significantly higher than at corresponding mid-northern latitudes. For example, peak UVI values in southern New Zealand are 25% and 40% greater than corresponding latitudes in North America
12 and Europe,13,14respectively. These differences are caused by seasonal changes in Sun-Earth separation, lower ozone amounts and clearer air in New Zealand, compared with the northern hemisphere locations. The geographical differences in UVI are very important as the skin type of many New Zealanders derive from ancestors in the United Kingdom, where UVI values are very much lower (since it is also at a higher latitude).
The UVI is thought to have increased in the last decade in response to changes in ozone. There has been a downward trend in ozone in the Tauranga region although large seasonal variations are evident, with a spring maximum and an autumn minimum. Over the period of major ozone decline (1979 to 2000), the reductions in summertime ozone have been larger in the southern hemisphere compared to the northern hemisphere. Consequently, increases in UVI have been more marked in the southern hemisphere. It has been estimated that for every unit increase in UV, the rates of melanoma should increase by 1-2%, all other things being equal. However, for a number of reasons (e.g. year-to-year differences in cloud cover, lack of suitable instrumentation to measure UV) there are only few measurements available worldwide to confirm the expected upward trend in UVI.
15
The overall age standardised incidence rate of invasive melanoma, for the non-Maori population of the Tauranga region was 79/100,000, which is higher than any other reported rate. This data does need to be interpreted with some caution as the total population of the Tauranga region is relatively small when compared to larger national populations such as in Australia, United States and Europe. The confidence limits are broad (63-94/100,000). However, the rates in Tauranga are consistent with studies of invasive melanoma in the Caucasian population of Auckland in 1995 (melanoma rate 56/100,000, population approximately 1.2 million)
16 and Waikato during 1990-95 (61-109/100,000, population 350,000) although the later study included melanoma in-situ.17
Previous studies of melanoma incidence in New Zealand have considered non-Maori populations (i.e. European New Zealanders), as they have been identified as those with the highest risk.
18 An earlier study of melanoma in Auckland, found that only 1.6% of cases of invasive melanoma occurred in non-Caucasians.18 The number of registrations of invasive melanoma for Maori and Pacific Islanders in New Zealand is very low, with only 11 Maori and 3 Pacific Island melanoma registrations nationally in 2000, when New Zealand had a total population of approximately 4 million.4 We are not aware of any of the 280 cases of melanoma or melanoma-in-situ in the current study, identifying themselves as Maori, but ethnicity data was not always recorded on the pathology reports.
In order to make comparison with data from cancer registries around the world, melanoma incidence was also calculated for the total population i.e. including all ethnicities. When all ethnicities are considered, the incidence of invasive melanoma for Tauranga and the Western Bay of Plenty (70/100,000) is still greater than that of Auckland, New Zealand or indeed Queensland, Australia (which has been previously regarded as having the highest melanoma incidence in the world at 51/100,000 for the year 2002.
19 (see also Table 2)
Comparisons with an earlier study in the Tauranga region, 25 years previously, are possible, albeit that study looked at invasive melanoma only.
6 In other respects, the methodologies of the two studies is similar and does allow comparison. Each study concerned the same population area served by the same pathology group practice. With respect to invasive melanoma, a higher age standardised incidence, a greater percentage of thin lesions and a corresponding reduction in thicker lesions was found in the current study. During the 1980's, the overall age standardised incidence of invasive melanoma in the region was 33/100,000, with 26% of lesions measuring less than 0.76mm thick, 29% between 0.76 to 1.49mm and 45% greater than or equal to 1.5mm.6 The present study found an incidence of 70/100,000 with 56% of lesions less than 0.76mm, 20% between 0.76 to 1.49mm and 24% greater than or equal to 1.5mm. The high proportion of thin lesions in the current study is consistent with a number of other New Zealand studies.16,26-31 The increase in rate from the 1980s equates to an increase of 6% per year. It has been noted in many countries, including New Zealand, that the rise in incidence is due to increased numbers of thin melanoma, with a reduction in the proportion of thicker lesions.2,3,5,16,31 These findings are encouraging as they imply earlier recognition of melanoma, which should be associated with improved prognosis.
Earlier New Zealand investigators,
6, 27 noted a female preponderance in incidence, however more recent studies, like ours have shown no difference between the sexes.16,,31 In this study, the commonest site of melanoma in males was the trunk, and in females the leg, which is consistent with findings from within New Zealand and around the world. 2,3,5,16,,31
The median Breslow depth found in the current study is similar to recently published figures for New Zealand, Australia and Europe.
17,31,32
This study has found that Tauranga and the Western Bay of Plenty have extremely high rates of melanoma, even for a country acknowledged as having one of the highest rates in the world. Why does New Zealand have such high rates of melanoma compared to Europe and North America? We believe the high rate of melanoma in New Zealand may be multi-factorial and in part can be explained by atmospheric, geographical, and societal factors.
During the southern hemisphere summer, the earth is closer to the sun than it is during the northern hemisphere summer. This by itself accounts for an additional 7% increase in incident ultraviolet radiation. New Zealand has significantly lower levels of measured atmospheric dust and pollutants than both North America and especially Europe.
13
Ozone depletion may also be an important atmospheric factor contributing to these increasing incidence rates of skin cancer. Since 1970, summertime ozone levels in New Zealand have decreased by approximately 10%.
15 Over a similar period, we have observed a 10-fold increase in skin cancer (currently 4,000/100,000, or a lifetime risk of 2 skin cancers/ person/ lifetime (authors unpublished data)). The highly non-linear increase suggests that there may be a threshold effect, so that the risk of developing melanoma increases more strongly once that threshold UVI is exceeded.
There is a lack of consensus in the literature regarding the UV action spectrum for melanoma induction, i.e. is it solely UVB or is it a mixture of UVB and UVA? Data from animal models (e.g. mice, fish, or possums) suggests it may be a mixture, albeit with weaker secondary peaks in the UVA region (315-400 nm).
33 Ozone has a greater filtering effect on UVB compared to UVA; falling ozone levels result in increased UVB but shouldn't effect UVA levels. Therefore, if both UVB and UVA are important in the development of melanoma in humans, then the observed increase in melanoma rate is less likely to be related solely to ozone depletion. However, the comparative risk for New Zealanders would still be greater compared to corresponding northern latitudes as the peak UVA levels in New Zealand are also up to 40% greater, due to differences in pollution and the closer Sun-Earth separation in December/January.
The peak UVI in northern New Zealand approaches the peaks seen in the tropics. In northern New Zealand, the summer median UVI exceeds 12 and occasionally reaches 15. This exceeds the UVI recorded at most sites in the USA, but is comparable to that seen at sea level in Hawaii (20ºN) where the summer median UVI is 11, and rarely exceeds 14. In San Francisco (37ºN), and Los Angeles (32ºN), the summer median is 9, rarely exceeding 11.
34 Southern Spain (37ºN) has a similar peak summer UVI of 11, with a median of 9.35 Therefore, a summer's day in New Zealand often has UV levels 40% or more above those for similar latitudes in the northern hemisphere.
Societal factors may also play a role in New Zealand's high incidence of melanoma. The majority of the population are, dermatologically speaking, genetically handicapped by their origin from principally the United Kingdom (latitudes 52-61ºN, peak summer UVI of 7, summer mean of 5). These people are principally Fitzpatrick skin type 1 or 2. They burn easily and tan with difficulty. Despite being poorly suited to live in an environment of high ultraviolet radiation, many New Zealanders embrace an outdoors lifestyle continuing to engage actively in competitive sport and many forms of outdoor recreation year round from childhood through adult life.
When one compares incidence rates of melanoma in New Zealand by latitude, with those of Australia, incidence rates in New Zealand are higher than one would expect by latitude alone. The rates of melanoma in Tauranga, Waikato and Auckland are considerably higher than those for Victoria, which lies at similar latitudes. The 1 in 14 lifetime risk of melanoma found in Tauranga is comparable with 1 in 19 in Queensland. However, Tauranga is found at latitude 37
oS, while Queensland lies in the tropics, between 26o-29oS. Why does New Zealand have higher rates of melanoma compared to similar latitudes in Australia?
The UVI values in populated areas of Australia are fairly similar to New Zealand, despite their lower latitudes. For example at Melbourne (38ºS) the peak UVI is 13 with a median of 10, and in Brisbane (26ºS), the peak UVI is 15 with a median of 13.
36 In summer the UVI in Brisbane, Queensland is generally lower due to cloud cover in that season. Perth has a similar annual total ultraviolet radiation dose as Brisbane despite being 4 degrees further south.37
Can genetic factors explain the difference between the incidence rates by latitude between Australia and New Zealand? While Queensland has a higher proportion of Asians and people of Southern European extraction, and therefore presumably a higher Fitzpatrick skin type, this is largely countered by New Zealand's Maori and Polynesian population. Northern European Caucasian proportions of the population in both countries is actually very similar.
8,38
New Zealanders and Australians have similar values of outdoor activity and participation in sport at all ages. They have been running similar national skin cancer awareness campaigns since the 1980s. The vast majority of New Zealanders and Australians know that getting sun burnt is bad for you and know that melanoma is a skin cancer caused by too much sun.
But perhaps the most important factor lies in New Zealand's unique geography and climate, which further encourages sun-seeking behaviour. Our narrow country, set in the southern ocean straddling the "Roaring Forties", is surrounded by cold ocean currents producing relatively cool summers, cold winds and moderate maximum summer temperatures, compared to most parts of Australia. The heat of many summer days in Australia (e.g. Victoria average peak temperature is 30°c, and often exceeds 40°c)
36 encourages people to seek shade in the most UV intense part of the day. In contrast, Tauranga average summer peak is 22°c and rarely exceeds 30°c, making it more pleasant to remain in the sun for long periods when outdoors.39Living in New Zealand can be compared to living at altitude in any other country, the temperatures are cool, but the UV is intense.
Why does Tauranga have such a high rate compared to other parts of New Zealand? Like the USA and Australia, there is an overall increase in rates of melanoma throughout New Zealand with decreasing latitude.
26,40 The high rates of Tauranga are probably exacerbated by Tauranga's high annual sunshine hours (2260 hours/annum) and a higher percentage of people aged greater than 65 years in Tauranga (17%) compared to Auckland (10%), New Zealand as a whole (12%) and Queensland, Australia (12%).8,39 As a relatively warm and sunny part of New Zealand, Tauranga attracts people who are sun-seeking and bring with them a legacy of prior sun-damage.
It has been argued recently that increases in rates of melanoma are simply due to increased vigilance.
41 However, studies of trends in melanoma by anatomic site, suggest that changes in lifestyle factors better explains the upsurge in melanoma.42-44In addition, if increased vigilance were the sole explanation for the increase, we should eventually see a sharp fall off in rates, as the biologically slowly-evolving melanoma were all diagnosed. This has not been seen, either in New Zealand or Australia. Apart possibly from some in-situ disease, the natural history of untreated (unresected primary) melanoma would be a mostly fatal one, through the eventual development of metastatic disease.
In conclusion, this study has found extremely high rates of melanoma in an area of high ultraviolet radiation. The rates in New Zealand are higher by latitude than those for Australia, and much higher by latitude than those in America or Europe. Whilst such a high incidence of melanoma can be linked to a number of atmospheric, geographic and societal factors, the rapid increase in these rates must be due to changing factors. Candidates to explain these are: (1) changes in population demographics, (2) changes in sun exposure patterns, (3) increases in UV due to reductions in ozone, and (4) changes in diagnostic efficiency. With the evidence currently available, we are not yet able to rank the relative importance of these effects but we can see an alarming increase in rates in comparison to previous data.
References
- Diepgen TL, Mahler V. The epidemiology of skin cancer. Br. J. Dermatol. 2002; 146 (Suppl 61): 1-6.
- Armstrong BK, Kricker A. Cutaneous melanoma. Cancer Surv. 1994; 19-20: 219-40.
- Marks R. Epidemiology of melanoma. Clin. Exp. Dermatol. 2000; 25: 459-63.
- New Zealand Health Information Service. Cancer: new registrations and deaths 2000. Wellington: Ministry of Health, 2004; 31.
- Lens MB, Dawes M. Global perspectives of contemporary epidemiological trends of cutaneous malignant melanoma.Br. J. Dermatol. 2004; 150: 179-85.
- Brown L, Palmer PH. Melanoma incidence in Tauranga 1980-9. N. Z. Med. J. 1991; 104: 109-11.
- Waterhouse J, Muir C, Shanmugaratnam K, Powell J. Cancer incidence in five continents IV. Scientific Publications no.42. International Agency for Research on Cancer (IARC), Lyon 1982.
- Statistics New Zealand. 2001 Census of population and dwellings. Wellington: Statistics New Zealand, athttp://www.stats.govt.nz/ (2002). (Accessed on 15th August, 2006.)
- Bray F, Guilloux A, Sankila R, Parkin DM. Practical implications of imposing a new world standard population. Cancer Causes Control 2002; 13: 175-82.
10. Bodeker GE, McKenzie RL. An algorithm for inferring surface UV irradiance including cloud effects. J.
Appl. Meteorol.1996; 35: 1860-77.
11. Bodeker G, Burrowes J, Scott-Weekly R, Nichol SE, McKenzie RL. A UV Atlas for New Zealand.
UV Radiation and its Effects Workshop; RSNZ, 2002.
12.
McKenzie R, Bodeker G, Scott G, Slusser J, Lantz K. Geographical differences in erythemally-weighted UV measured at mid-latitude USDA sites. Photochem. Photobiol. Sci. 2006; 5: 343-52.
13. Seckmeyer G, McKenzie RL. Increased ultraviolet radiation in New Zealand (45ºS) relative to Germany (48ºN).
Nature1992; 359: 135-7.
14. McKenzie RL, Kotkamp M, Seckmeyer G, Erb R, Gies R, Toomey S. First southern hemisphere intercomparison of measured solar UV spectra.
Geophys. Res. Lett. 1993; 20: 2223-6.
15.
McKenzie R, Connor B, Bodeker G. Increased summertime UV radiation in New Zealand in response to ozone loss.Science 1999; 285: 1709-11.
16.
Jones WO, Harman CR, Ng AK, Shaw JH. Incidence of malignant melanoma in Auckland, New Zealand: highest rates in the world. World J. Surg. 1999; 23: 732-5.
17. Rademaker M, Zainal Z. Melanoma blackspot of the world?
Melanoma Research 1997; 7(Suppl 1): S77-78.
18. S
haw JH. Malignant melanoma in Auckland, New Zealand. Surg. Gynecol. Obstet. 1988; 166: 425-30.
19.
Coory M, Baade P, Aitken J, Smithers M, McLeod GR, Ring I. Trends for in situ and invasive melanoma in Queensland, Australia, 1982-2002. Cancer Causes Control 2006; 17: 21-7.
20. New Zealand Health Information Service, at
http://www.nzhis.govt.nz/publications/cancer02.pdf (2007). Accessed on 3rd March, 2007.
21. Cancer in Queensland. Incidence and Mortality 1982 to 2004, at
http://www.health.qld.gov.au/hic/qcr2005/qcr82-04.pdf(2007). Accessed on 3rd March, 2007.
22. Cancer in New South Wales Incidence and Mortality Report 2004, at
http://www.cancerinstitute.org.au/cancer_inst/publications/pdfs/IncidenceMortalityReport2004.pdf(2006). Accessed on 3rd March, 2007.
23. Victorian Cancer Facts and Figures from the Cancer Council Victoria Epidemiology Centre, at
http://www.cancervic.org.au/cancer1/facts/pdfs/facts_figures/2_details/melanoma_2.pdf(2003). Accessed on 3rd March, 2007.
24. Cancer in Australia 2001, Australian Institute of Health and Welfare, at
http://www.aihw.gov.au/publications/can/ca01/ca01.pdf(2004). Accessed on 3rd March, 2007.
25. State Cancer Profiles, National Cancer Institute, at
http://statecancerprofiles.cancer.gov/incidencerates/index.phpAccessed on 3rd March, 2007.
26.
Cooke K, McNoe B, Hursthouse M, Taylor R. Primary malignant melanoma of skin in four regions of New Zealand. N. Z. Med. J. 1992; 105: 303-6.
27.
Hursthouse MW. Melanoma in the Nelson-Marlborough area of New Zealand. Australas. J. Dermatol. 1987; 28: 7-10.
28.
Burton RC, Armstrong BK. Current melanoma epidemic: a nonmetastasizing form of melanoma? World J. Surg. 1995; 19:330-3.
29.
Hursthouse MW. Melanoma incidence and trends in the Nelson-Marlborough area of New Zealand. N. Z. Med. J. 1992;105: 424-5.
30.
Cooke KR, McNoe BM. Targeting early detection of malignant melanoma of the skin. N. Z. Med. J 1990; 103: 551-3.
31.
Martin RC, Robinson E. Cutaneous melanoma in Caucasian New Zealanders: 1995-1999. ANZ J. Surg. 2004; 74: 233-7.
32.
Garbe C, McLeod GR, Buettner PG. Time trends of cutaneous melanoma in Queensland, Australia and Central Europe.Cancer 2000; 89: 1269-78.
33.
Wang SQ, Setlow R, Berwick M, Polsky D, Marghoob AA, Kopf AW, Bart RS. Ultraviolet A and melanoma: a review. J. Am. Acad. Dermatol. 2001; 44: 837-46.
34. Climate Prediction Center. National Oceanic & Atmospheric Administration (NOAA),
U.S. Department of Commerce, athttp://www.cpc.ncep.noaa.gov/ (2006). (Accessed on 15th August, 2006).
35.
Martinez-Lozano JA, Marin MJ, Tena F, Utrillas MP, Sanchez-Muniosguren L, Gonzalez-Frias C, et al. UV index experimental values during the years 2000 and 2001 from the Spanish broadband UV-B radiometric network. Photochem. Photobiol. 2002; 76: 181-7.
36. Australian Radiation Protection and Nuclear Safety Agency, at
http://www.arpansa.gov.au/ (2006). (Accessed on 15thAugust 2006.)
37.
Gies P, Roy C, Javorniczky J, Henderson S, Lemus-Deschamps L, Driscoll C. Global Solar UV Index: Australian measurements, forecasts and comparison with the UK. Photochem. Photobiol. 2004; 79: 32-9.
38. Australian Census 2001. Australian Bureau of Statistics, at
http://www.abs.gov.au/ (2006). Accessed on 15th August 2006).
39. UV and Ozone, NIWA Science, at
http://www.niwascience.co.nz/services/uvozone/ (2006). (Accessed on 15th August 2006.)
40.
Bulliard JL, Cox B, Elwood JM. Latitude gradients in melanoma incidence and mortality in the non-Maori population of New Zealand. Cancer Causes Control 1994; 5: 234-40.
41.
Welch HG, Woloshin S, Schwartz LM. Skin biopsy rates and incidence of melanoma: population based ecological study.B.M.J. 2005; 331: 481.
42.
Bulliard JL. Site-specific risk of cutaneous malignant melanoma and pattern of sun exposure in New Zealand. Int. J. Cancer 2000; 85: 627-32.
43.
Bulliard JL, Cox B. Cutaneous malignant melanoma in New Zealand: trends by anatomical site, 1969-1993. Int. J. Epidemiol. 2000; 29: 416-23.
44.
Bulliard JL, Cox B, Elwood JM. Comparison of the site distribution of melanoma in New Zealand and Canada. Int. J. Cancer 1997; 72: 231-5.
Tables
Table 1 Number of patients with invasive and in-situ melanomas
Male | Female | Total | |
Invasive | 63 | 68 | 131 |
In situ | 72 | 77 | 149 |
Total | 135 | 145 | 280 |
Table 2 Age standardised incidence of invasive melanoma in Tauranga, New Zealand, and other regions.
Region | Study year | Age standardised incidence per 100 000 (CI) | |||
Non-Maori or European | All ethnicities | ||||
Male | Female | Male | Female | ||
Tauranga, NZ | 2003 | 77 (57,96) | 80 (62,98) | 71 (53,88) | 73 (56,89) |
Auckland, NZ16 | 1995 | 58 | 55 | ||
New Zealand39 | 2002 | 36.3 | 33.6 | ||
Queensland, Australia40 | 2004 | 70.6 | 51.9 | ||
New South Wales, Australia41 | 2004 | 60 | 40.6 | ||
Victoria, Australia42 | 2001 | 27.6 (25.9,29.4) | 23.4 (21.9,25.1) | ||
Australia43 | 2001 | 42.4 | 31.6 | ||
USA44 | 2002 | 20.9 (20.6,21.1) | 13.6 (13.4,13.8) | ||
World43 | 2000 | 2.4 | 2.2 | ||
More developed world43 | 2000 | 6.7 | 6.1 | ||
Less developed world43 | 2000 | 0.8 | 0.6 |
(CI = confidence intervals; NZ = New Zealand; USA = United States of America)